Anthony G. Smith, Andrew M. Hopkins, Richard W. Hunstead and Kevin A. Pimbblet Below are animated spins of 20 groups and clusters, 53 filaments and 47 voids, identified in SDSS DR7 data by MSPM. A box that encompasses the rumoured scale of statistical homogeneity is shown on this page. For each field, three modes of visualisation have been produced: particle plots that show the raw galaxy distribution, isosurfaces based on the smoothed galaxy density field and solid particle renders. Try not to lose sight of how huge these are!**
These .gif files are each a few megabytes. Groups and Clusters Groups and clusters from Table 1 of our paper. These have transverse side lengths of 8 Mpc/h and contain a redshift interval (shown vertically) of Δz = 0.01 (~ 28 Mpc/h) to contain galaxies displaced by radial motions. Isosurfaces are based on three-dimensional gaussian smoothing with σ = 1 Mpc/h.
Filaments Filaments from Table 5 of our paper. These cubes have transverse side lengths of 20 Mpc/h and line-of-sight lengths of Δz = 0.01 (~ 28 Mpc/h) to contain galaxies displaced by radial motions. Isosurfaces are based on three-dimensional gaussian smoothing with σ = 1 Mpc/h.
Voids These cubes have side lengths of 80 Mpc/h. ID numbers simply refer to positions in a lattice used to sample the SDSS volume. Isosurfaces are based on three-dimensional gaussian smoothing with σ = 5 Mpc/h. A box that encompasses the rumoured scale of statistical homogeneity is shown on this page.
The animated gifs were encoded by images2gif from python's visvis library. ***In solid particle renders, MSPM groups and clusters are Gaussian blurs with various properties colour-coded. Overdensity probabilities between 0.5 and 1 are mapped to blue values between 0 and 1, and this is also the intensity of each group. Radius is red such that a ~ 1 Mpc/h structure has a red value of one and a 0.5 Mpc/h structure has a red value of 0.5, etc. The radius (σ) of the Gaussian blur is the radius of the structure. Elongation values used for the green colours are averages of the five values obtained within 10 Mpc/h. The actual elongation probabilities calculated for our paper are maximum values that are the same for many adjacent groups and not as visually interesting to use. **Somewhat related (from xkcd) - 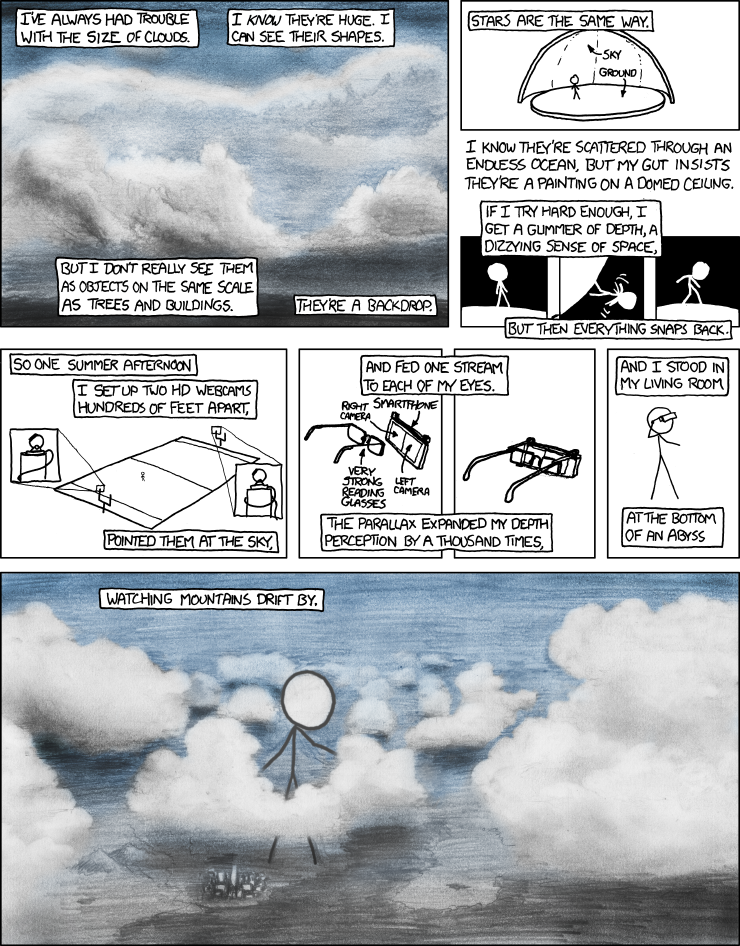 |


