Stuff I've Done
If she says she can do it
Then she can do it
She don't make false claims!
- David Bowie, "Queen Bitch" (Hunky Dory)
. . . well some of it, anyway.
I hold two science degrees (Maths, Physics), a teaching degree and a data science certification.
I've been in various lines of work and my works are varied accordingly.
In what I suppose is my version of a portfolio, here are samples of what I have done on various projects (but some of my best work isn't yet in the public domain).
Along with always doing what I'm supposed to, I often add a dash of flair.
If any of these impress, fantastic.
If any of these also amuse, even better.
If you'd like to work with me, shoot me an email (astroant@hotmail.com).
Contents
Data, Statistics and Algorithms — Analysis, Prediction and Simulation
Webpages
Teaching Resources - with Technology
Slides
Publications
Visualisations
Data, Statistics and Algorithms — Analysis, Prediction and Simulation
Webpages
|
My Personal Website
|
I guess this isn't really work, but it is the most extensive webpage I've created, and a sample of my informal writing.
Written in HTML by yours truly.
|
|
Web page I created to present results
|
A page I wrote to make a more publicly-accessible front for some research.
Demonstrates basic proficiency in HTML and content management systems like wikis (this was also a page at my institution, but they're not very good at updating links), and hopefully a dash of taste.
It has a link to a page showing three-dimensional visualisations I generated with my own code.
This page is procedurally-generated, so that major alterations to the formatting are simple to implement.
|
Teaching Resources - with Technology
|
Olympus Mons in Virtual Reality
|
This is a virtual reality environment I created that allows one to climb Olympus Mons, on Mars.
This animation shows what one may see as one approaches, climbs and walks around the top of Olympus Mons in this environment.
Mars is actually red, so the colours are wrong.
The frame rate has been reduced in this animation, but the motion on most computers is smoother than this suggests. | 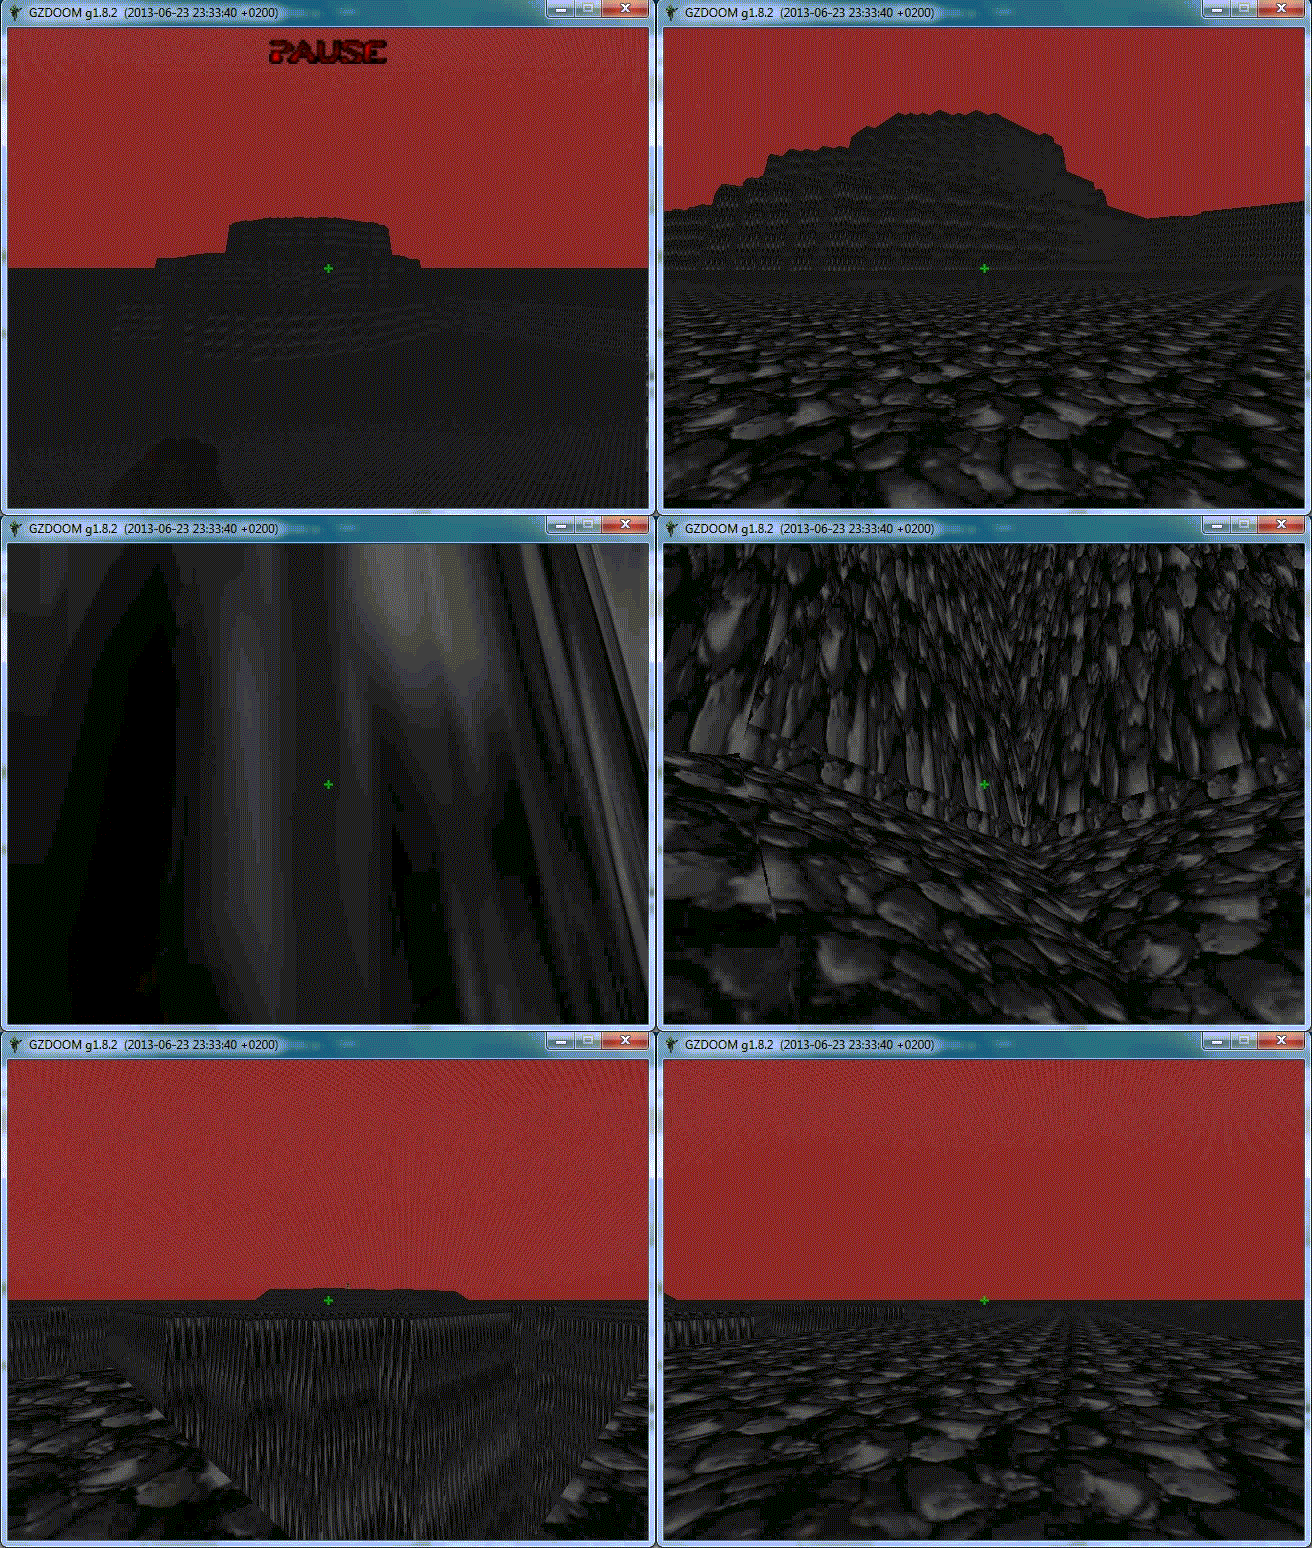 |
To try this for yourself, copy this zip file to some directory (right-click and "save link as" or "save target as"):
Olympus Mons in Virtual Reality .
Unzip the contents of the file to some place.
On Windows, in a file browser double-click on RunMars.bat .
It may be necessary to modify permissions so you can run it.
This should run the game.
Type " idclip ", which gives you the ability to walk through and over walls and cliffs.
Use the arrow keys to move, and the mouse to look around.
When finished, press the escape key and click on quit to leave the game and close the window.
Feel free to let me know if you encounter any issues accessing or running this.
It's only a prototype and there are some obvious problems with it, but is a proof of concept that earned me a High Distinction grade in the assessment I submitted it for.
I created it with a height map of Olympus Mons, a utility called ZTerrain and GZDoom Builder.
It runs in a port of the Doom engine, GZDoom, and uses content from the Freedoom project.
|
|
An Activity to Demonstrate Some Basic Principles of Statistical Sampling
|
This is a program that I have written to accompany a worksheet activity for the Preliminary Mathematics General Course, to address the Data and Statistics strand.
This program and worksheet are available from this page.
For an assessment I completed for a Mathematics Teaching Methods course I wrote an evaluation of this resource, an adapted version of which can be found here.
I have written the code and compiled the program in Python.
|
Slides
These are from teaching statistics at SCU Sydney, written by me.
Publications
|
2012 Research Paper
|
Based on my Master's research. In this work we presented a new approach to identifying structure in galaxy data, a multiscale algorithm that made significant progress on a long-standing problem.
It certainly has more citations than my other paper, but I don't really know what an impressive number would be here.
|
|
2008 Research Paper
|
Based on my Honours research. In this work we employed non-local statistics to examine correlations and intrinsic clustering in data.
|
Visualisations
|
Animated Three-Dimensional Spin Visualisations of Structures in Our Universe
|
When it comes to visualisation, I can totally do the basics - if you want to see scatter plots, trends, maps and so forth, look at my publications and knock yourself out.
And those are both necessary and revelatory - but during my MSc I decided I wanted to really bring some of the results to life, make them look cool.
I mean, what is the point of finding the most impressive structures in the Universe if you're not going to visualise them properly?
None of the tools I had at hand could do the sort of visualisation I wanted, so I wrote some software of my own to do the job.
And these animated three-dimensional spins are what I came up with.
|
|
Fun with tableau
|
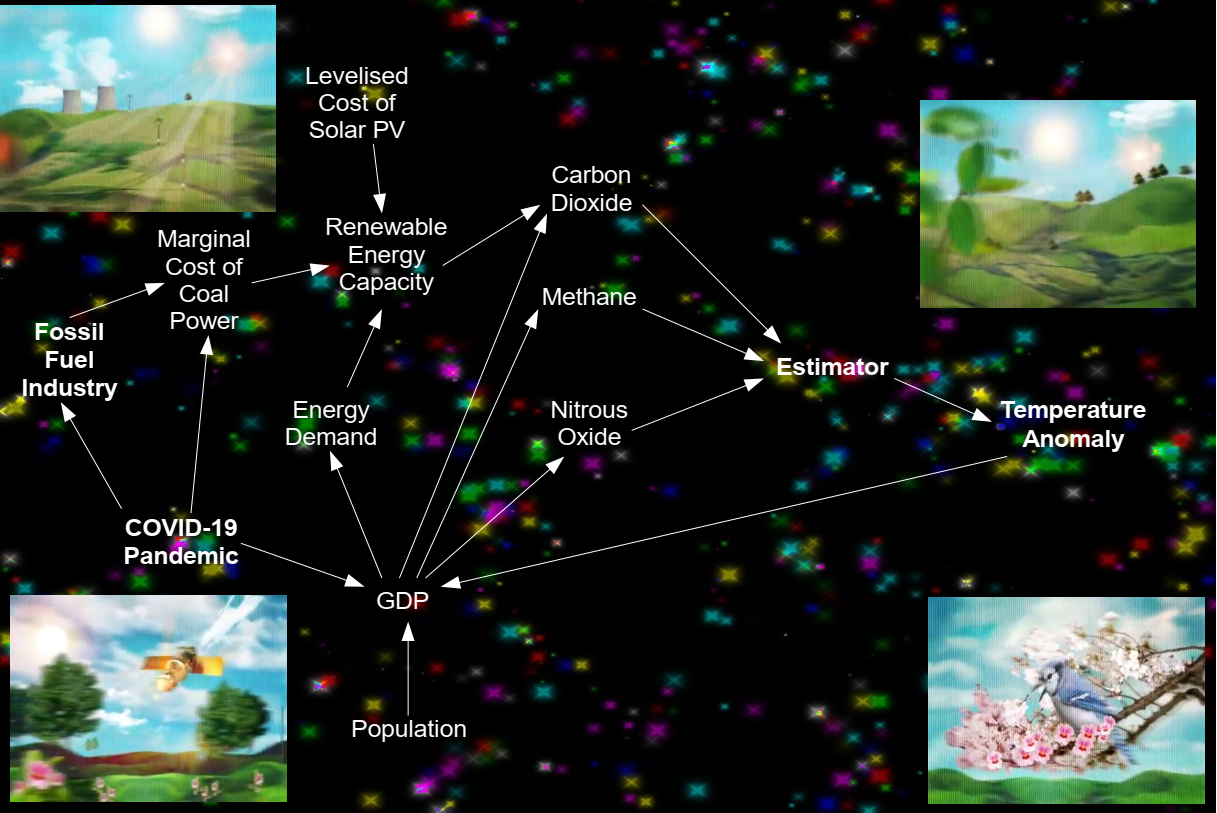
The Peacock in the Snow: Linear Additive Modelling and Principal Component Analysis of Climate Change.
There's also a commentary here, but the links to the viz are broken because they keep changing. There's also
Watch That Man: Trends and Statistics on the Discography of David Bowie
Again with a page of broken links for the same reason.
|
|
Procedurally-Generated Digital Artwork
|
I like procedural generation, and I like art.
So when confronted with the task of creating art for a computer game remake, with no visual-artistic know-how, I resorted to procedural generation in code.
The stellar pattern is an emulation of a two-point correlation function with a power-law slope (which I was familiar with from galaxy clustering statistics).
And as you might have guessed, I later reused the code to apply the digital ink on the three-dimensional spin visualisations of my MSc.
I liked it enough that it's the background for the site you now stand in.
|
|